Publication · arXiv:2601.14479
Can LLM Reasoning Be Trusted?
We built a 2,000-question statistical-reasoning benchmark, had three PhD statisticians grade a held-out set of answers, then asked which automatic metric agreed with them. The standard ones agree by accident.
Automatic metrics are what make evaluation affordable. You cannot put a statistician in front of every answer a model produces, so you use a metric as a proxy and trust that it tracks what an expert would have said. This paper asks what that trust is worth on statistical reasoning, where an answer can be fluent, well-structured and confidently wrong.
The setup
We built a curated 2,000-question statistical-reasoning benchmark and released it. Three models were evaluated: LLaMA-3 8B and Mistral-Nemo 7B, both fine-tuned with LoRA and 8-bit quantisation, plus DeepSeek-R1-Qwen 7B used as released.
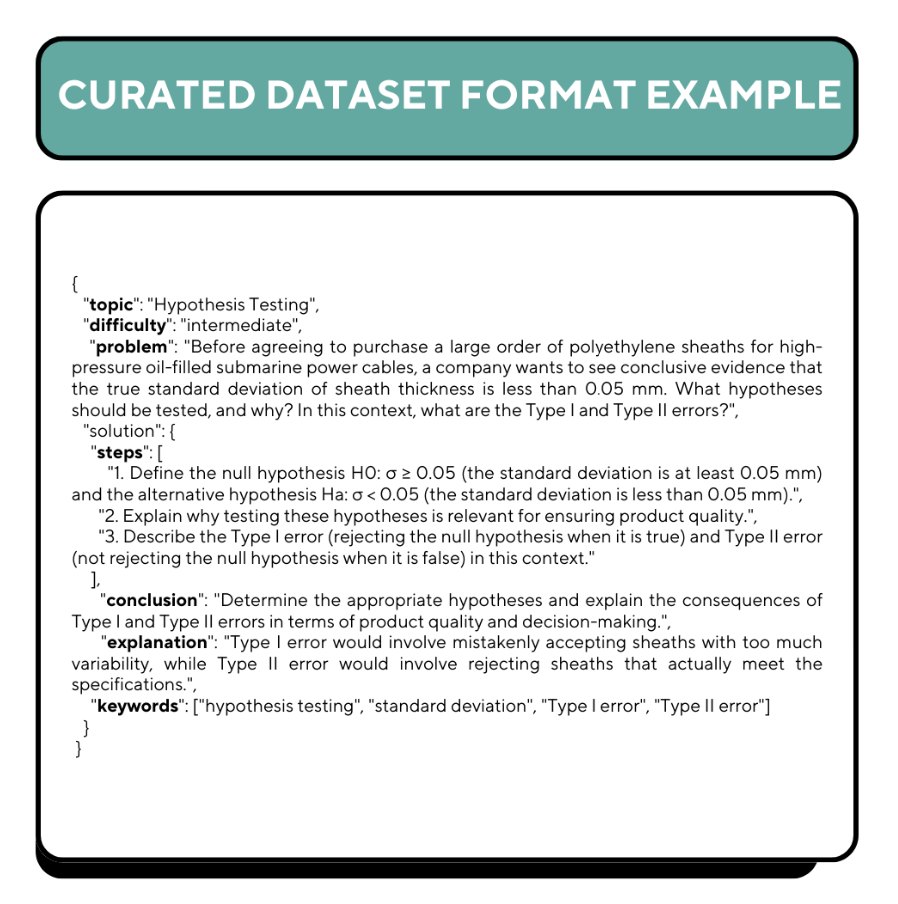
On a held-out set of 50 questions, three PhD statisticians from the Department of Statistics at Leeds graded every answer against a rubric weighting correctness 40%, explanation 35% and reasoning 25%. Those ratings are the reference everything else is measured against.
What the standard metrics agree with
The question is rank correlation: given the same answers, does a metric order them the way the statisticians did?
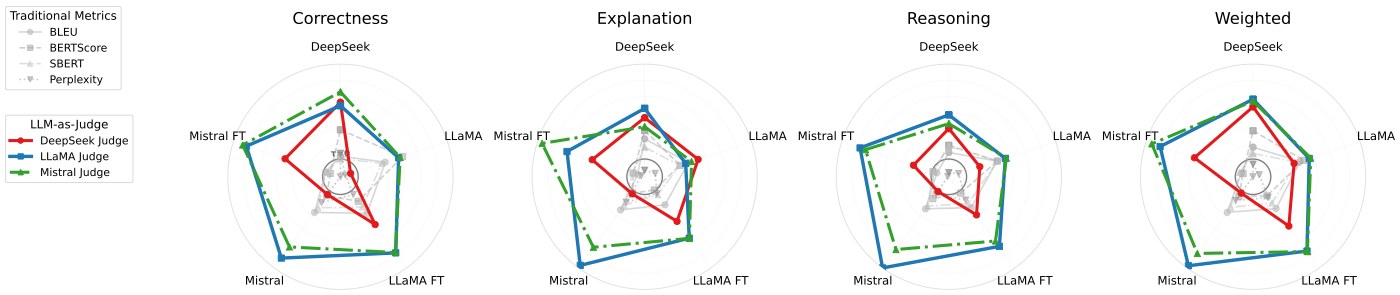
BERTScore reaches τ = 0.022. That is close enough to zero to be agreement by accident. A pipeline using it to decide whether a fine-tune improved statistical reasoning is reading noise.
The fine-tuned LLaMA-3 judge reaches τ = 0.536. That number belongs to that judge model — not to the rubric in the abstract, and not to LLM-as-judge in general. Swap the judge and you are measuring something else.
The same picture holds across every system and every rubric dimension. The traditional metrics collapse into a knot at the centre; the LLM judges track the human shape.
Where judges get soft
The judges are less discriminative on incorrect answers than correct ones. They separate good work from great work more reliably than they separate wrong work from right work. The paper flags this as possibly reflecting sycophancy, citing Perez et al., and the hedge is deliberate: the experiment was not designed to isolate that mechanism.
The direction is what matters for anyone building on this. The failure mode of an LLM judge is not random error. It is a bias toward the answer being acceptable, and that bias points the same way as the thing you were trying to detect.
Why this became the spine of everything after
If the instrument that grades reasoning is itself unreliable, every downstream claim inherits that unreliability — and the field runs on those claims. That is the thread from this paper through auditing a scheming judge against mechanical ground truth and auditing an eval-awareness probe at a realistic base rate.
Same question each time, in a different domain: is the measurement doing what its users believe it is doing?